
PEAK EMISSIONS?
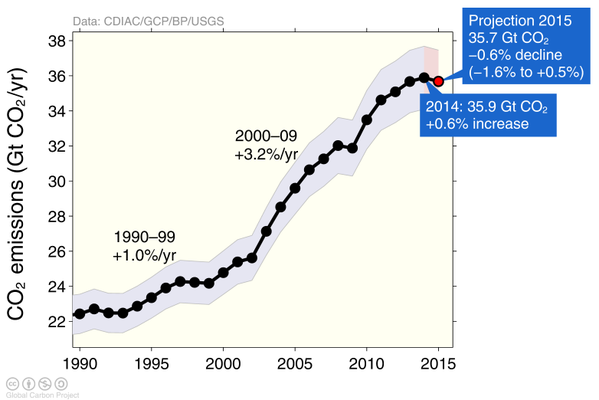
One of the potentially best pieces of news of 2015 came in just before its closing. While all eyes were directed toward Paris the Global Carbon Budget projection for 2015 was announced (Le Quere et al. 2015). It included the uplifting news that total annual emissions in 2015, for only the second time since the turn of the century, were projected to decrease.
What is even more notable is that globaL economic activity, measured as the global gross domestic product, was projected to increase per capita from 2014 (IMF World Economic Outlook).
Taken together, these two trends raise several questions.
- (1) What caused the 2015 dip and was 2014 the peak of global CO2 emissions?
- (2) Is the concurrent increase in global GDP a sign of absolute decoupling between economic activity, material use and environmental quality?
- (3) Will trends in both variables continue into the future?
WAS 2014 THE PEAK OF CARBON EMISSIONS?
The short answer to this question is, “probably not”. That’s according to the folks at the Global Carbon Project, who produce the annual Global Carbon Budget, i.e. they know what they are talking about. We’ll get back to this later, but check out the Global Carbon Budget publication if you cannot wait.
Global Carbon Budget 2015 - http://www.globalcarbonproject.org/carbonbudget/
THE 2009 vs 2015 EMISSION DECREASES
The last time we saw a reduction in annual global carbon emissions was from 2008 to 2009 at the onset of the great recession. At that time the contraction in the global economy, in particular of the richer countries, led to a dip in carbon emissions. But economic growth was back in 2010, the next year, and so were global carbon emissions.
In fact, the growth in global carbon emissions in 2010, almost completely compensated for the fall in 2009. This was probably a result of all the carbon-intensive stimulus that governments pumped into national economies (Tienhaara 2010).

WHAT CAUSED THE 2015 DIP?
The global GDP is projected by the International Monetary Fund (IMF) to increase from 2014 to 2015 from 15,189 to 15,655 calculated in US dollar at price purchasing parity. I haven’t been able to find any sources challenging this projection, so let’s assume it will stand.
So, if it was not a contraction in the global economic output, what then caused the 2015 decrease in emissions? One traditional way of illustrating the contributions to global carbon emissions, is to use the so-called Kaya identity.
THROUGH THE EYE OF THE KAYA IDENTIY
The Kaya identity is inspired by the old IPAT theorem (Ehrlich & Holdren 1971), stating that environmental impact (e.g. CO2 emissions) is the product of population, the size of the economy (A, usually GDP per cap) and the environmental intensity (not efficiency) of technology (T, usually measured as E/GDP).
Since we rarely know the environmental intensity of technology/economy, the Kaya identity breaks the technology component into two other components that we have better statistics on. The carbon intensity of energy use (C) and the energy intensity of the economy (E). What is left on the left side of the equation is CO2 emissions from energy consumption (I).
I = PAT -> I = PAEC

RECENT EMISSIONS, POPULATION & AFFLUENCE
Looking at the components of the Kaya identity from 1971 to 2009 it is clear that the two main drivers of increasing carbon emissions are population growth and growth in GDP per capita. On the other hand, improved energy and carbon efficiencies (decreased intensities) of respectively the economy and energy use, has been far from enough to decrease emissions, or even keep them stable. We also see that all recent temporary decreases in emission have been during times of stalled or decreasing size of the economy (cf. 1973, 1979, 1991, 2008).
2015: INCREASING CARBON EFFICIENCY
We can now also say something about the 2015 dip in carbon emissions. Did it arise from increasing carbon efficiencies of energy use or did it result from increasing energy efficiency of the global economy? Over on the Future Earth blog the lead-author of the Global Carbon Budget study, Corine Le Quéré - also a Future Earth Science Committee member - gives her explanation:
“The projected decline is largely down to China’s decreased coal use, driven by its economic adjustment. Whether a slower growth in global emissions will be sustained depends on the use of coal in China and elsewhere, and where new energy will come from. In 2014, more than half of new energy needs in China were met from renewable sources such as hydro, nuclear, wind, and solar power.”
So it seems the reduction is largely due to increasing carbon efficiency.
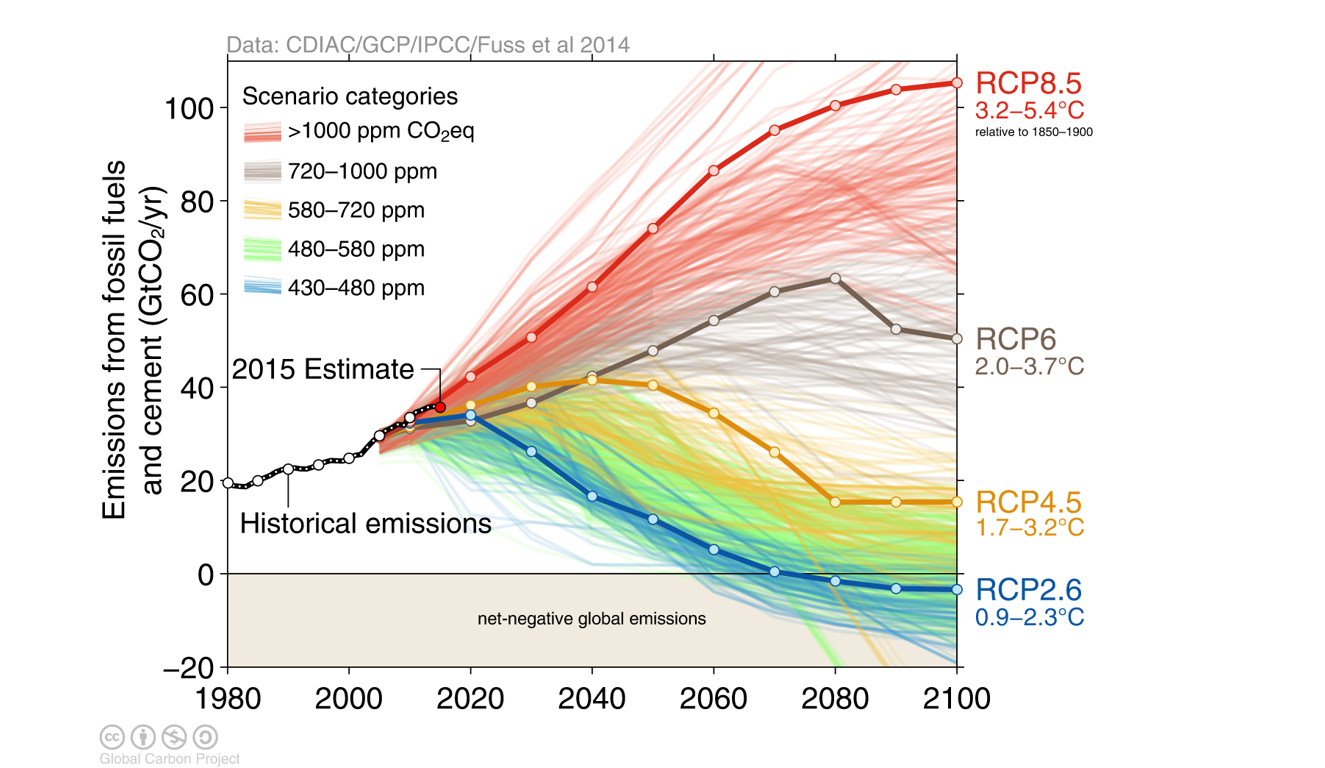
IS ABSOLUTE DECOUPLING HERE TO STAY?
Most scenarios agree that we need to reach zero emissions around 2050 (and negative emissions soon thereafter), that is if we are to meet the goal of keeping global warming between 1.5 and 2 C. So the reduced emissions in 2015 are very welcome. But the Global Carbon Project scientists are not too optimistic about the trend sustaining itself. That's because many other developing countries will want to grow their economies based on traditional energy sources to reach the wealth that China has during the past decades. Corine Le Quere explained this way:
"With two years of untypical emissions growth, it looks like the trajectory of global emissions might have changed temporarily. It is unlikely that emissions have peaked for good. This is because energy needs for growing economies still rely primarily on coal, and emissions decreases in some industrial countries are still modest at best."
Let's hope that renewable energy will spread quickly enough that many developing countries can growth their economies on more sustainable energy sources.
SAFE AND JUST ABSOLUTE DECOUPLING
Whether or not 2014 was the peak of carbon emissions, and whether or not absolute decoupling between global GDP and CO2 emissions will continue, there are a broader set of factors we must take into account to assess the sustainability of decarbonization.
To ensure that efforts to decarbonize does not result in environmental or social degradation we need to expand the discussion about absolute decoupling from largely being focused on GDP and CO2 emissions to embrace social and environmental dimensions that may be impacted by the decoupling. The framework of the "safe-and-just operating space for humanity" identify critical social and environmental variables the limits that we must reach (social) or stay within (environmental) while we transition our economies.
Applying this framework we are less likely to trade off progress on one environmental issue, such as CO2 emission cuts, for set backs on another, such as biodiversity declines due to large investments in mega-dams for hydropower expansion (Winemiller et al. 2016).

To achieve both socially just and environmentally safe development, we need to expand the Kaya identity to be not just about CO2 emissions, but all the variables of Raworth's doughnut. If we imagine the four knobs of the Kaya identity for the 9 planetary boundaries, we can address issues of unchecked population growth in developing economies (Dasgupta and Ehrlich 2013), share the wealth better, reduce waste (the energy efficiency of the economy), and invest in real green energy, such as wind and solar, that are less likely to harm the environment in other ways (such as some biofuels, hydropower, or geoengineering techniques).
Literature
Raworth (2011) - A Safe and Just Space for Humanity: Can we live within the doughnut? OXFAM report. & Nature Climate Change interview - Living in the doughnut - Nature Climate Change 2, 225–226 (2012) doi:10.1038/nclimate1457. Published online 04 March 2012